
How kudurru works
A visual tour of kudurru as it is built today: where a DNS query goes, how a client's policy is chosen, how configuration travels from a YAML file or the dashboard to every node, and how the deployment shapes fit together. Every page leads with a picture and then explains it.
This tour is for contributors and for operators who want to know what happens inside. For running kudurru, read the guide and the deployment docs. For why it is built this way, read the design record and its decision log (D1 onwards); where the code and the design record disagree, these pages follow the code and say so.
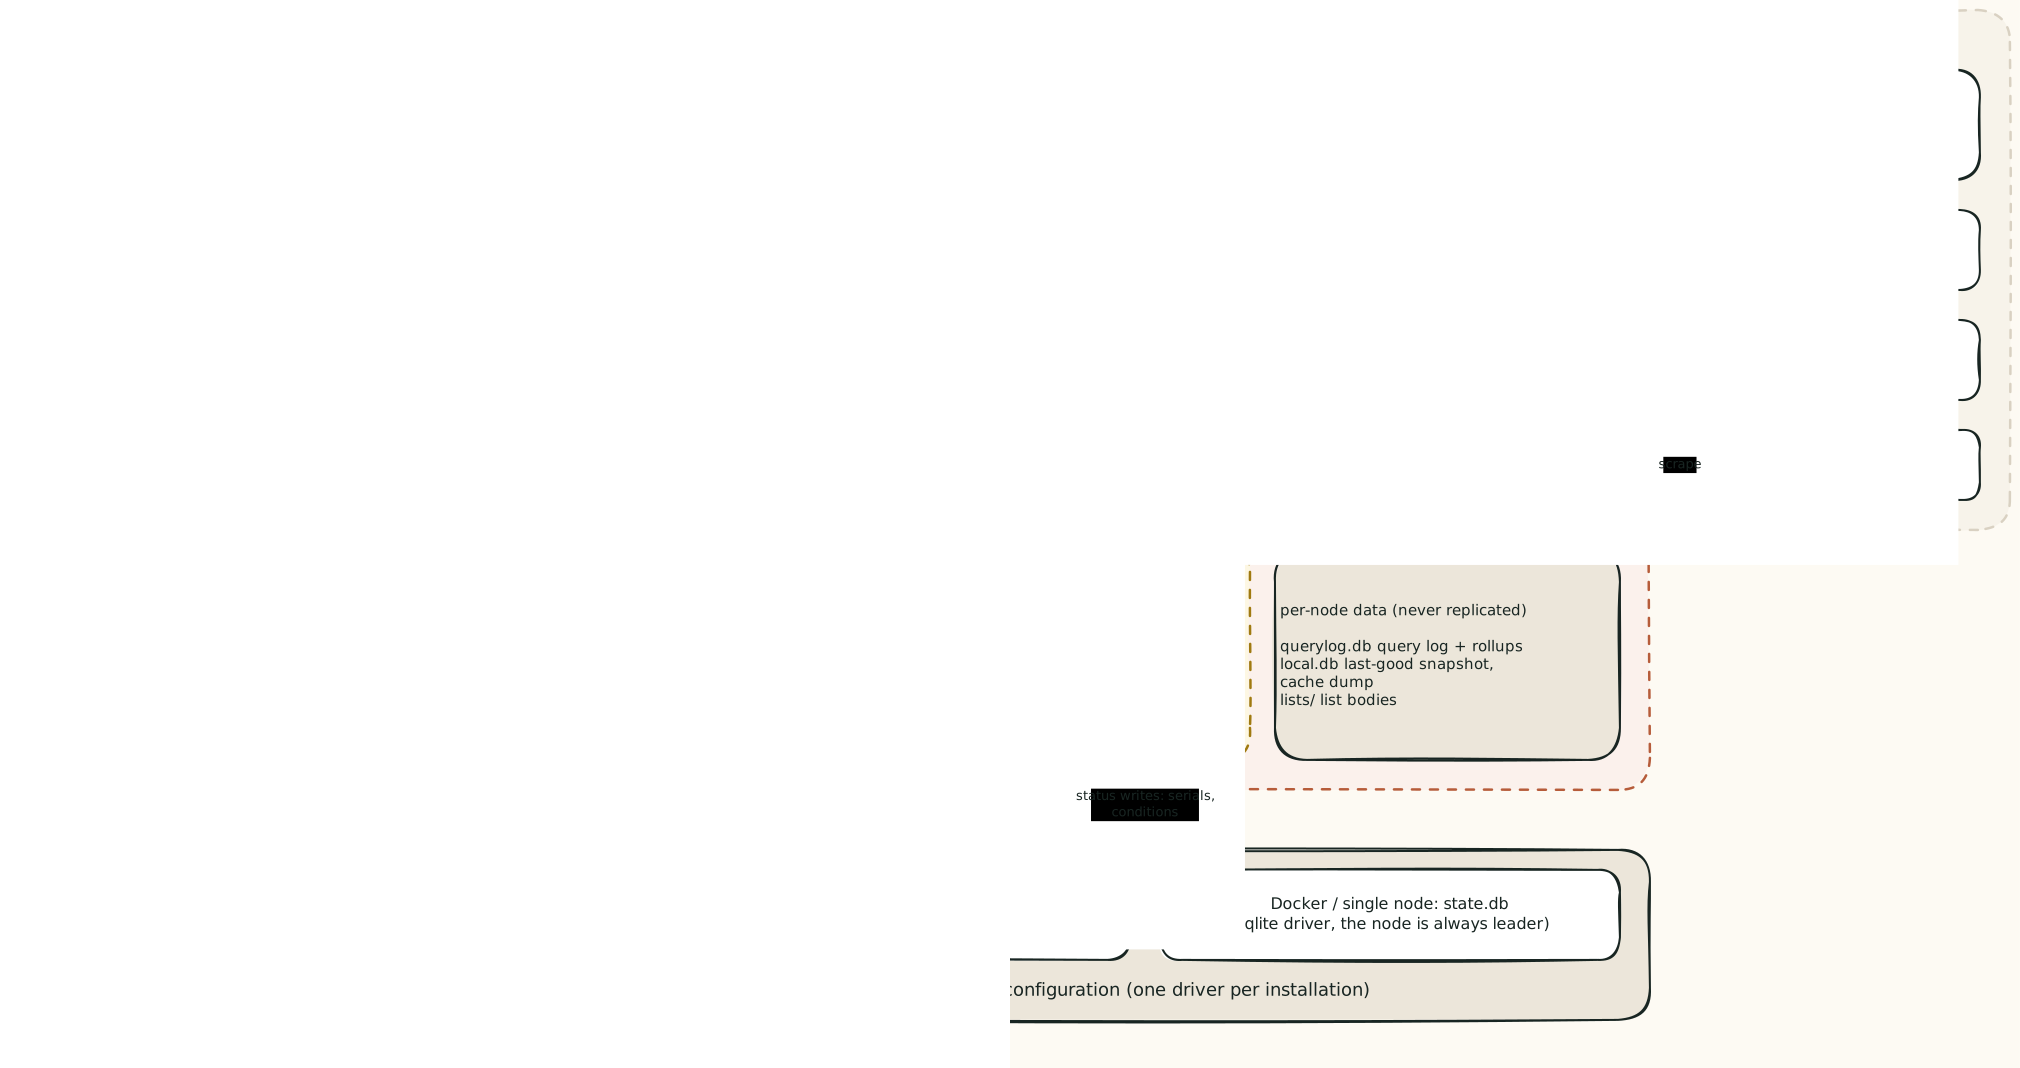
The tour
| Page | What it shows |
|---|---|
| A query's journey | the seven pipeline stages, every way a query can leave them, and the status each outcome gets |
| Clients, policies and blocking | how a client is identified, how its policies are merged, how one name is judged, the block page and unblock requests |
| Block lists | how a list is fetched once by the leader, shared with every node, compiled and swapped in |
| Upstreams and the cache | which upstream group answers, strategies, server health, the cache and serve-stale |
| Zones and transfers | authoritative answers, serials, NOTIFY and AXFR/IXFR |
| Configuration and the store | the object model, the two store drivers, the write path, the snapshot, leader election and settings |
| Deployment shapes | one container, Kubernetes, compose HA with dnsdist and keepalived, and what happens when something fails |
| Access: sign-in, tokens and RBAC | principals, the authentication chain, OIDC sign-in, authorization, the node-to-node plane |
| Observability | the query log pipeline, metrics, health probes and audit |
Five ideas that explain most of the design
- One binary, every node the same. Each replica runs the whole pipeline, the API and the dashboard. A few loops (status, serials, NOTIFY, list downloads) run on exactly one node, the leader.
- The store is the only source of truth for configuration. In
Kubernetes it is the apiserver (CRDs); in Docker it is
state.db. Everything else is derived from it or local to one node. - The query path never touches the store. Each node watches the store and builds an in-memory snapshot. Queries read the snapshot without a lock, and the node keeps answering from it when the store is away.
- The pipeline is fixed. The stage order is code, not configuration, so every answer can be explained by the stage that produced it.
- Runtime data stays on the node. The query log, the response cache and list bodies are per node; only configuration is replicated.
One process, many loops
kudurru serve starts one runner. Loops in the first group run on every
node from the start; loops in the second group run only while the node
holds the leader election, and stop (without stopping the process) when it
loses it.
flowchart LR
    subgraph every["every node"]
        direction TB
        dns["dns listeners<br/>udp tcp dot doh doq doh3"]
        zc["zonecache<br/>(store watch → snapshot)"]
        lr["list resolver<br/>(compile lists)"]
        api["api + dashboard :8080"]
        ops["health :8081, metrics :9153"]
        internal["node-to-node :8082"]
        more["settings reload, objects loader,<br/>query log writer, cache sweep and<br/>persist, block page, admin socket,<br/>external-dns webhook"]
    end
    subgraph leader["leader only"]
        direction TB
        ctrl["controller<br/>(status, serials)"]
        notifier["notifier<br/>(NOTIFY out)"]
        lf["list fetcher<br/>(downloads)"]
        jan["unblock janitor"]
        dl["allow/deny list sync"]
        ap["audit prune<br/>(sqlite only)"]
    end
    elect{{"leader election<br/>kube: Lease kudurru-controller<br/>sqlite: always this node"}} --> leader
Some loops start only when their feature is on (the block page, the
external-dns webhook, the query log writer, the admin socket). There is no
roles: setting: every node runs the full set.
Ports
| Port | Listener | Who calls it |
|---|---|---|
| 53 udp/tcp (5353 behind an edge) | DNS | clients, or dnsdist with PROXYv2 |
| 853 tcp / 443 tcp / 853 udp / 443 udp | DoT, DoH, DoQ, DoH3 (off by default) | clients |
| 8080 | REST API /api/v1 and the dashboard | browsers, the CLI, automation |
| 8081 | /healthz/*, /lameduck (no auth) | probes, kudurru health, kudurru lameduck |
| 8082 | node-to-node API (always TLS + token) | other replicas, edge supervisors |
| 9153 | /metrics | Prometheus |
| 80 (443) | block page (when enabled) | browsers sent there by a block answer |
| 127.0.0.1:8888 | external-dns webhook (when enabled) | external-dns |
unix /run/kudurru/kudurru.sock | admin socket | kudurru admin inside the container |
Built and not built
The design record plans more than v0.1 ships. These pages describe the code. The main gaps between the two:
| Planned in the design record | State in the code |
|---|---|
13 pipeline stages (local, rewrite, dnssec, postprocess, …) | 7 stages; the other names are reserved in pipeline.Order |
follower and raft store drivers | kube and sqlite only |
| scatter-gather across nodes | the node list is gathered (GET /nodes lists every replica and fetches its status over :8082); /nodes/{other}/health returns 501 and scope=cluster stats are answered by the serving node |
| cluster-wide temporary disable of blocking | per node, in memory |
| client match by MAC, hostname, DoT/DoH client ID | match by IP and CIDR (the index supports the rest; no transport fills them in) |
cluster.role: static read-only twins | no such key; each twin is an independent sqlite node |
| secondary zones, NOTIFY in, dynamic UPDATE | NOTIMP; kudurru only sends NOTIFY |
| Kubernetes Events from the controller | events are logged only |
The open list lives in follow-ups.
Reading the diagrams
Two kinds of pictures appear on these pages:
- Hand-drawn diagrams (
diagrams/*.excalidraw.svg) give the big picture. Each SVG embeds its Excalidraw scene: open it at excalidraw.com (menu → Open) or with the Excalidraw extension for VS Code, edit it, and export it again as SVG with "Embed scene" checked, under the same name. - Mermaid diagrams (in the markdown) show flows, sequences and states. GitHub and the docs site render them; edit them as text.
Colours in the hand-drawn diagrams:
| Colour | Meaning |
|---|---|
| clay | kudurru code |
| blue | clients, people and tools |
| purple | dnsdist and keepalived (GPL, separate processes) |
| stone | stored data |
| yellow | leader-only work, warnings |
| green / red | an answer / a block |
| white | systems outside kudurru |