
1. Overview
This chapter explains the terms of kudurru and the way that it decides what to do with a query. It also explains the roles and the layout of the dashboard.
Terms
| Term | Meaning |
|---|---|
| Node | One running kudurru server. A network can have more than one node. |
| Client | A device that sends queries to kudurru, for example a laptop or a television. |
| Client group | A set of clients. A group matches clients by address, address range, client ID or MAC address. |
| Block list | A list of names that kudurru blocks. |
| Allow list | A list of names that kudurru never blocks. |
| Policy | The rules for one or more client groups: which lists and services apply, how kudurru answers a blocked query, and when. |
| Zone | A part of the DNS name space for which kudurru gives the answers. |
| Record | One DNS entry in a zone, for example an A record. |
| Upstream | An external DNS server that kudurru asks when it has no answer. |
| Upstream group | A named set of upstreams with a strategy and a time limit. |
| Block page | A web page that a blocked name can lead to. It explains the block. |
| Request | A message from a user who asks an administrator to allow a blocked name. |
How kudurru decides
When a client sends a query, kudurru does these steps in this order:
- It finds the client group of the client. A client that no group claims
belongs to the group
default. - It finds the policies of the group. If more than one policy is active, the policy with the highest priority decides the settings. kudurru merges the lists of all the active policies.
- It answers from your own zone if the name is in one. A block list cannot block a name in your own zone.
- It checks the allow lists. A name on an allow list is never blocked.
- It checks the block lists and the blocked services. If the name matches, kudurru gives the block answer of the policy.
- It looks in the cache.
- It asks an upstream group.
kudurru writes each answer to the query log with the reason. Chapter 3 shows how to read the reason.
Who manages an object
Every object has one owner. The dashboard shows the owner as a badge. You can change an object in the dashboard only when its owner is API.
| Badge | Meaning | How to change the object |
|---|---|---|
| API | You made it in the dashboard, with the command line or with the API. | Use the dashboard. |
| default | kudurru made it at the first start. | Use the dashboard. |
| managed by file | It comes from a file in the objects.d directory. | Change the file. The dashboard is read-only. |
| managed by Kubernetes | It is a custom resource in a cluster. | Use kubectl. The dashboard is read-only. |
NOTE: A switch or a button for a read-only object is gray. The dashboard does not hide the object.
Roles
A role is a set of permissions. An administrator gives a role to each person. Table 1 shows what each role can do in the dashboard.
| Role | Can read | Can change |
|---|---|---|
| Viewer | Statistics, zones, records, lists, policies, groups, clients, settings | Nothing. A viewer can make API tokens for itself. |
| Auditor | Everything that a viewer reads, and the query log, the access requests and the audit log | Nothing |
| Operator | Everything that an auditor reads, except the audit log | Records, lists, policies, groups, clients, the blocking switch, the cache, the access requests |
| Zone admin | Statistics, and the zones and records in its scope | The zones and records in its scope |
| Admin | Everything | Everything, including settings |
Table 1. The roles.
Chapter 9 explains how to give a role to a person.
The dashboard
Figure 1 shows the dashboard after the first sign-in.
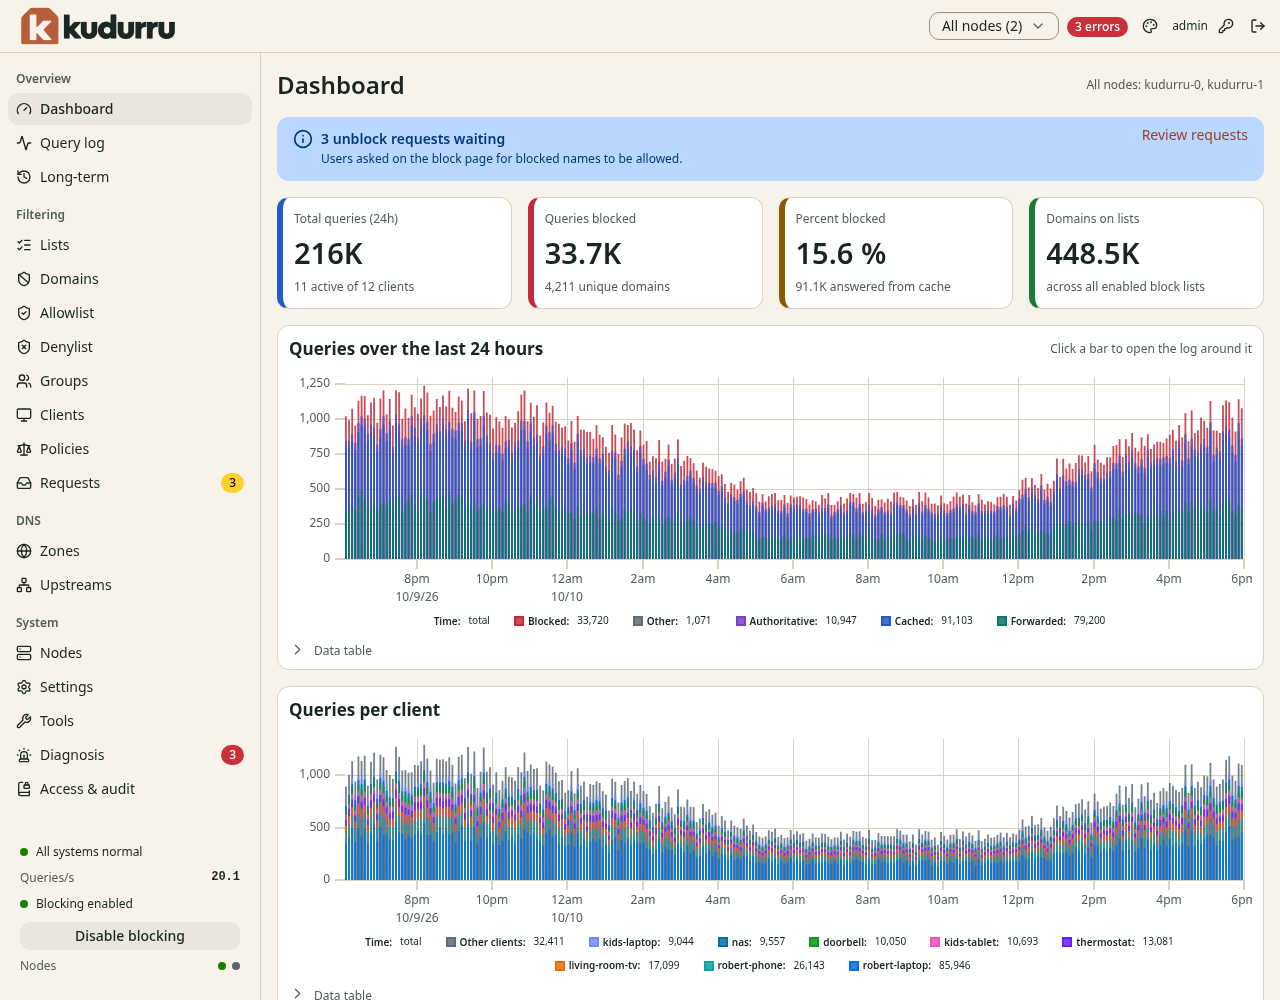
Figure 1. The dashboard.
The navigation list
The navigation list is at the left. It has four sections.
| Section | Pages |
|---|---|
| Overview | Dashboard, Query log, Long-term |
| Filtering | Lists, Domains, Allowlist, Denylist, Groups, Clients, Policies, Requests |
| DNS | Zones, Upstreams |
| System | Nodes, Settings, Tools, Diagnosis, Access & audit |
A number in a red or yellow badge next to a page shows the count of messages (Diagnosis) or of open requests (Requests).
The top bar
The top bar has these items, from left to right:
- Node scope: select All nodes or one node. The statistics pages show the data of the node that you select.
- The message badge, for example 3 errors. It shows the number of diagnosis messages. Click it to open Diagnosis.
- The palette icon: open the Appearance dialog. It sets the mode, the theme and the contrast for this browser.
- Your user name.
- The key icon: change your password.
- The sign-out icon.
The status area
The status area is at the bottom of the navigation list. It shows:
- All systems normal, or a message about a problem
- Queries/s: the number of queries in each second
- Blocking enabled or Blocking disabled, and the button that changes it
- Nodes: one dot for each node. A green dot means that the node is ready.
Wizards, pages and dialogs
kudurru uses the same pattern for all the things that you create.
- A New … button opens a wizard in a dialog. The wizard has steps. The last step is Review. kudurru saves nothing until you click the button on the Review step.
- A Back button returns to the step before. Your input stays.
- After you create an object, the dashboard opens the page of the object.
- To change an object later, open its page. Each part of the page has an Edit button.
- View as YAML shows the object as YAML. This is the same text that
kudurru applyaccepts. - Delete asks you to confirm before it removes the object.
Where kudurru keeps its data
| Item | Docker | Kubernetes |
|---|---|---|
| Objects (zones, lists, policies, groups) | state.db in the data volume | Custom resources |
| Users, tokens, audit log | state.db | Secrets in the cluster |
| Query log | querylog.db in the data volume | querylog.db on each pod |
| Settings | kudurru.yaml, and settings.yaml for changes made in the dashboard | ConfigMap |
Chapter 11 explains how to back up this data.