
3. Watch the network
This chapter shows how to read the statistics. It also shows how to find the reason for an answer in the query log and how to turn blocking off for a short time.
Before you start: You have the role Viewer or a higher role. The query log needs the role Auditor, Operator or Admin.
Use the node scope
A cluster can have more than one node. The pages Dashboard, Query log, Long-term and Clients show the data of the nodes that you select.
- Click Node scope at the top of the page.
- Select All nodes or the name of one node.
Figure 1 shows the list.
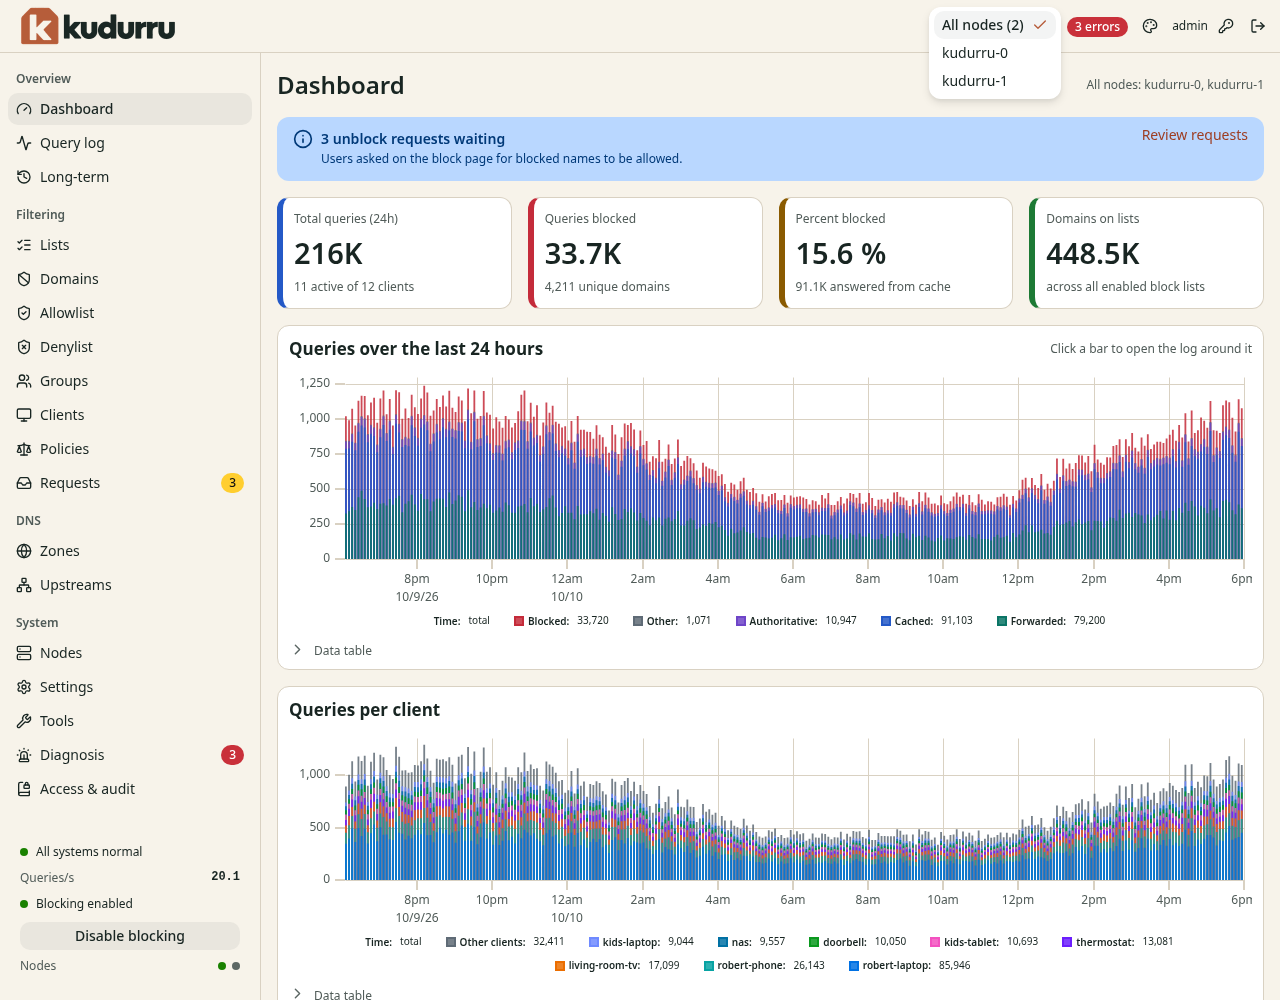
Figure 1. The node scope list.
The line at the right of the page title tells you which nodes answered. If a node does not answer, the line says that the result is partial.
Read the dashboard
Open Overview > Dashboard. Figure 2 shows the page.
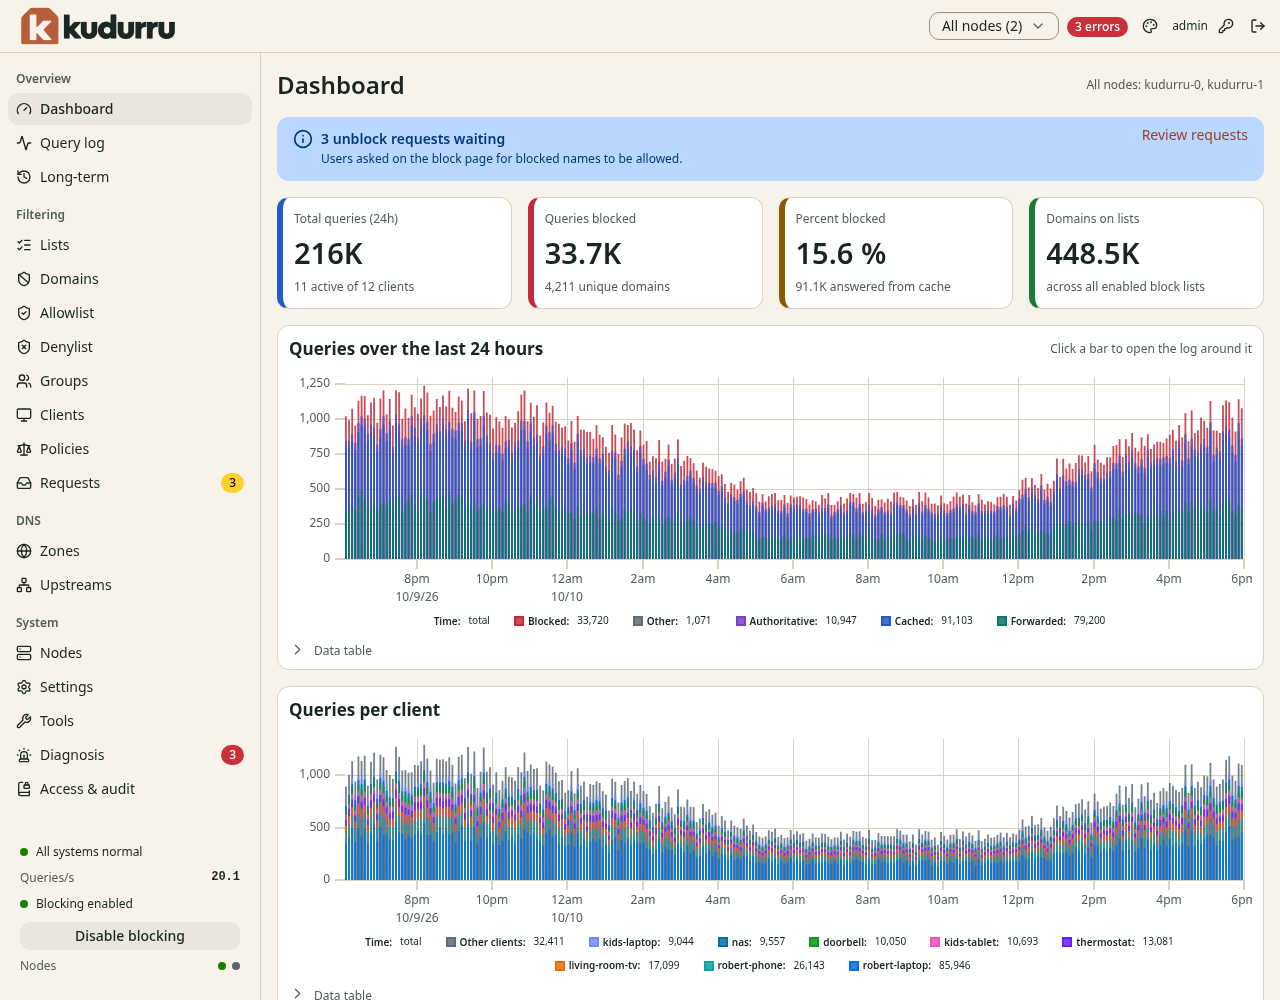
Figure 2. The dashboard.
The tiles
| Tile | Meaning |
|---|---|
| Total queries (24h) | The number of queries in the last 24 hours, and how many clients sent them |
| Queries blocked | The number of blocked queries, and how many different names they had |
| Percent blocked | The share of blocked queries, and how many kudurru answered from the cache |
| Domains on lists | The number of names on all the enabled block lists |
The notice for requests
A blue notice shows when users wait for an answer. The notice says unblock requests waiting. Click Review requests to open the Requests page. Chapter 6 explains how to answer them.
The charts
- Queries over the last 24 hours shows the queries in time. Each bar has colors for blocked, authoritative, cached and forwarded queries. Click a bar to open the query log around that time.
- Queries per client shows which clients send the queries.
- Data table below a chart shows the same data as a table.
Scroll down to see more (Figure 3).
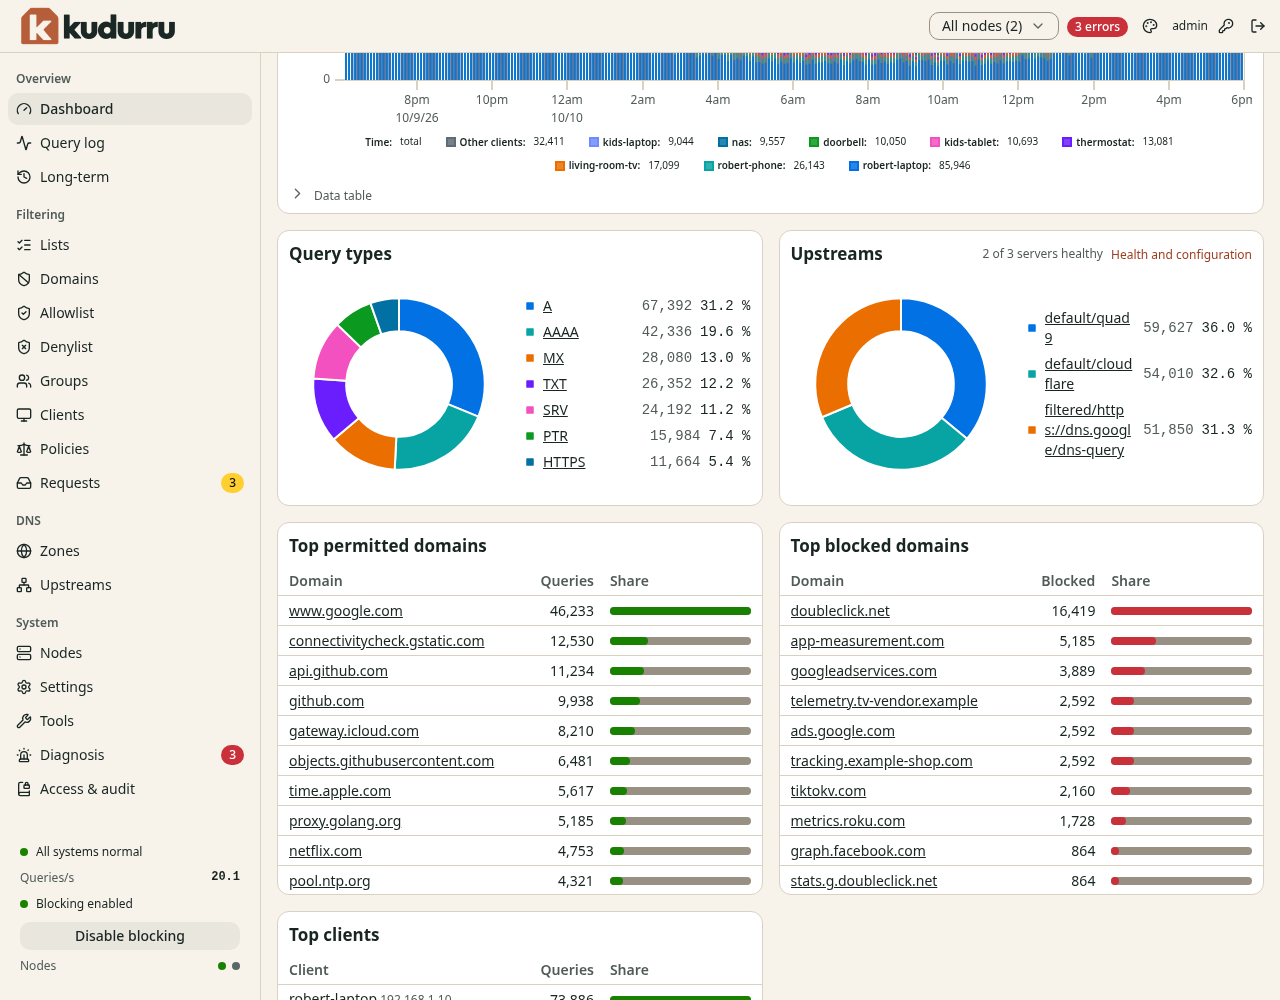
Figure 3. The lower part of the dashboard.
- Query types shows the types of the queries, for example
AandAAAA. Click a type to filter the query log. - Upstreams shows which upstream answered how many queries. The text next to the title shows how many servers are healthy. Click Health and configuration to open the Upstreams page.
- Top permitted domains, Top blocked domains and Top clients are tables. Click a name to open the query log for that name.
Turn blocking off for a short time
Use this function to find out if a block list causes a problem.
- Click Disable blocking in the status area at the bottom of the navigation list.
- Select a time: 10 seconds, 30 seconds, 5 minutes or
Indefinitely. Or enter another time in Other duration, for
example
90sor1h30m. - Click Disable.
Figure 4 shows the dialog.
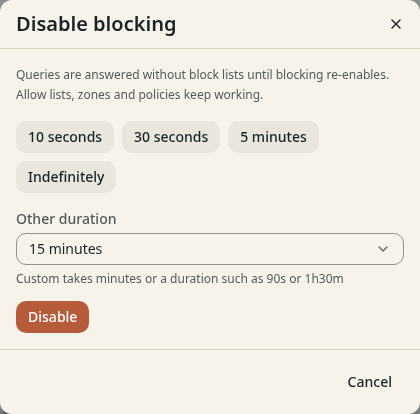
Figure 4. The dialog Disable blocking.
While blocking is off, kudurru answers queries without the block lists. The allow lists, the zones and the policies stay active. The status area shows Blocking disabled, re-enables in and the time that is left. After Indefinitely it shows Blocking disabled indefinitely.
To turn blocking on again before the time ends, click Enable blocking.
CAUTION: If you select Indefinitely, blocking stays off until someone turns it on. Do not forget it.
The role Operator or a higher role is necessary for this function.
Use the query log
The query log shows each query that kudurru answered, and the reason for the answer. Open Overview > Query log. Figure 5 shows the page.
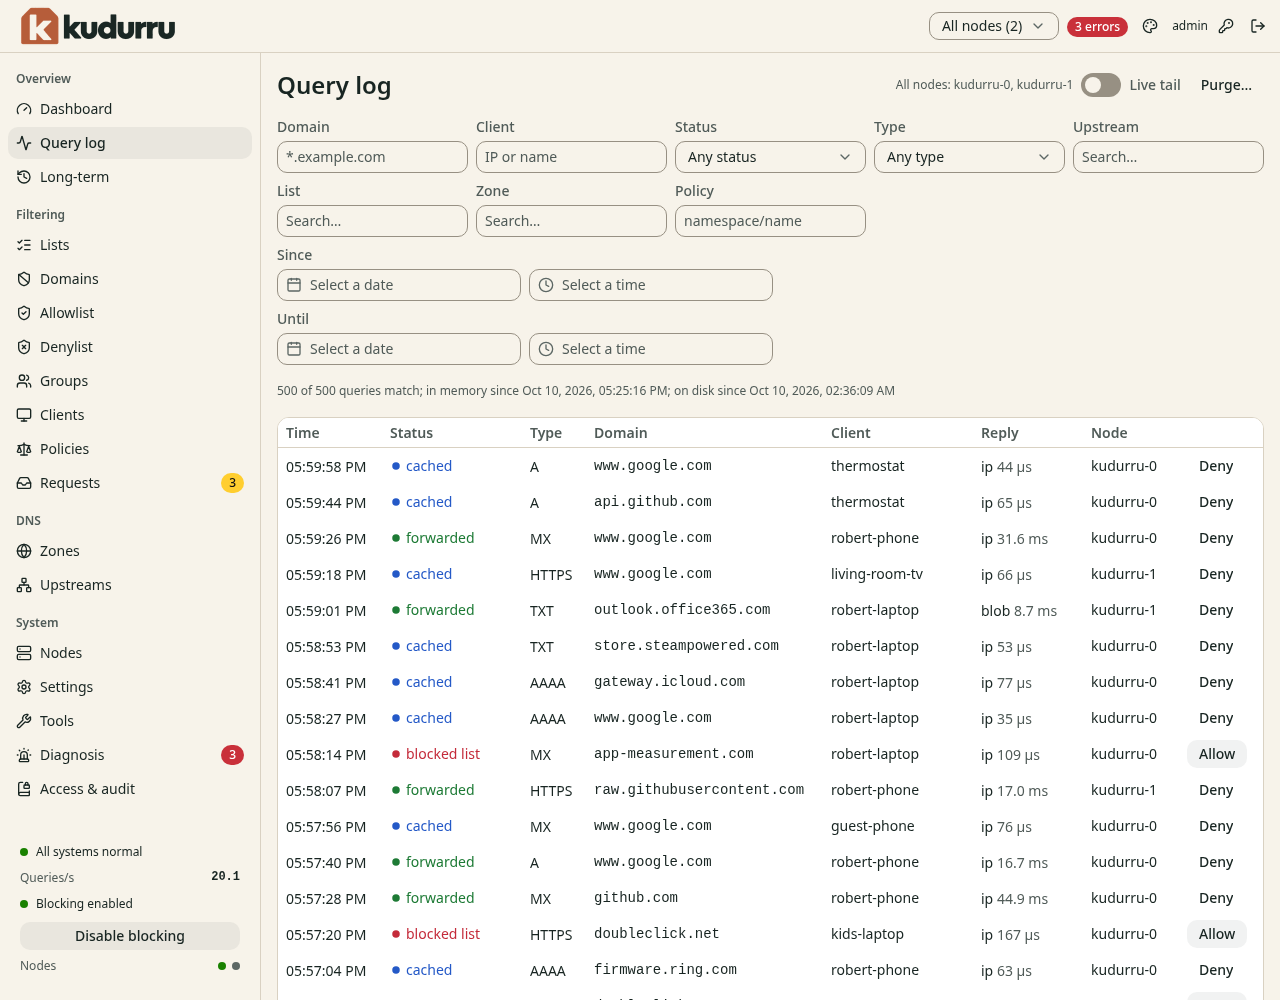
Figure 5. The query log.
The table has these columns:
| Column | Meaning |
|---|---|
| Time | The time of the query |
| Status | The result, for example forwarded, cached, blocked list or blocked regex |
| Type | The DNS type of the query, for example A |
| Domain | The name that the client asked for |
| Client | The name or the address of the client |
| Reply | The kind of the answer and the time that kudurru needed |
| Node | The node that answered |
The line above the table shows how many queries match the filters. It also shows the time of the oldest query in memory and on disk.
Filter the query log
- Enter a value in one or more filter fields. Use
*as a wildcard in Domain, for example*.example.com. - Press Enter, or select a value from the list.
You can filter by Domain, Client, Status, Type, Upstream, List and Zone. Since and Until limit the time. The values of Status are Permitted, Cached, Blocked and Errors. Click Clear filters to remove all the filters.
The address of the page holds the filters. You can send the address to another administrator.
Find out why a name was blocked
- Open the Query log.
- Select Blocked in Status.
- Enter the name in Domain.
- Click the row of the query.
The row opens and shows the details (Figure 6).
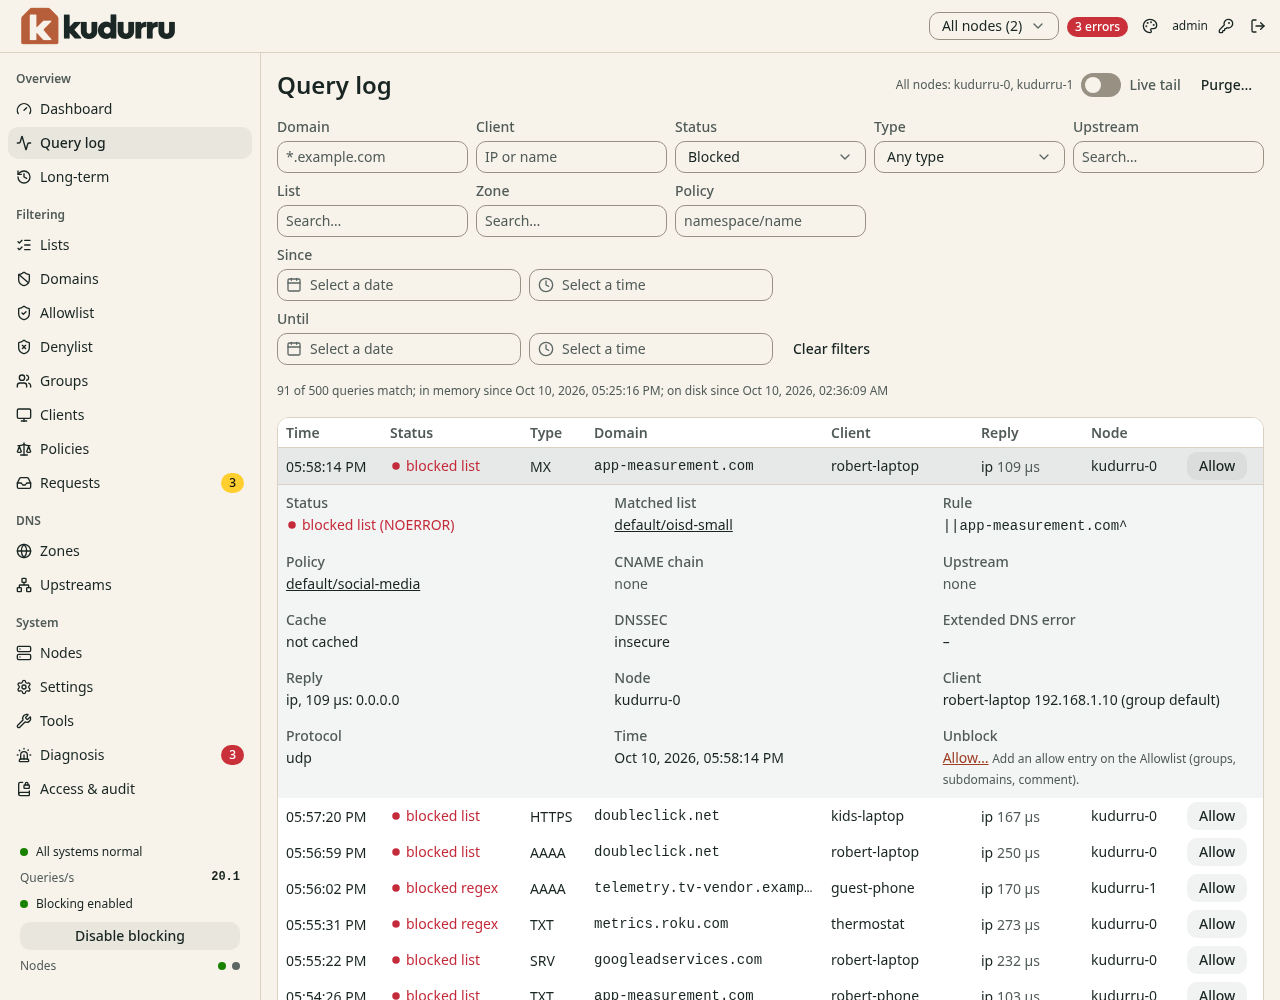
Figure 6. The details of a blocked query.
| Detail | Meaning |
|---|---|
| Status | The result, for example blocked list (NOERROR) |
| Matched list | The list that has the name. Click it to open the list. |
| Rule | The rule that matched the name, for example ||app-measurement.com^ |
| Upstream | The upstream that answered. none means that kudurru did not ask one. |
| Cache | If the answer came from the cache |
| DNSSEC | The result of the DNSSEC check |
| CNAME chain | The names that the answer pointed to |
| Extended DNS error | A code that tells the client why kudurru blocked the name |
| Client | The client and its client group |
| Protocol | The transport, for example udp |
Allow or deny a name from the log
Each row has a button at the right.
- On a blocked row, click Allow to add the name to the Allowlist.
- On other rows, click Deny to add the name to the Denylist.
kudurru adds an exact entry for all clients. The entry has the origin
query log. The role Operator or a higher role is necessary. Chapter 4
explains the lists.
Follow new queries
Turn on Live tail at the top right of the page. New queries show at the top of the table when they arrive. Turn the switch off to stop.
Delete old rows
The role Admin is necessary for this function.
- Click Purge… at the top right of the page.
- Select Older than, or select Every row.
- If you selected Older than, enter the date and the time in Delete rows before.
- Click Delete older rows or Delete every row.
Figure 7 shows the dialog.
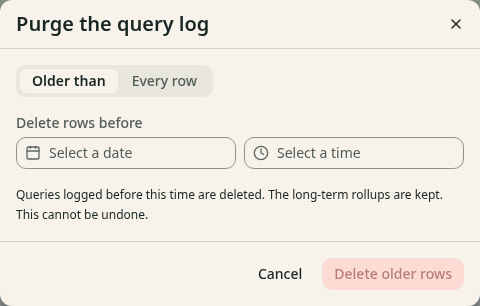
Figure 7. The dialog Purge the query log.
CAUTION: You cannot undo this action. kudurru keeps the long-term statistics.
Read the long-term statistics
Open Overview > Long-term. The page shows the statistics for a longer time (Figure 8).
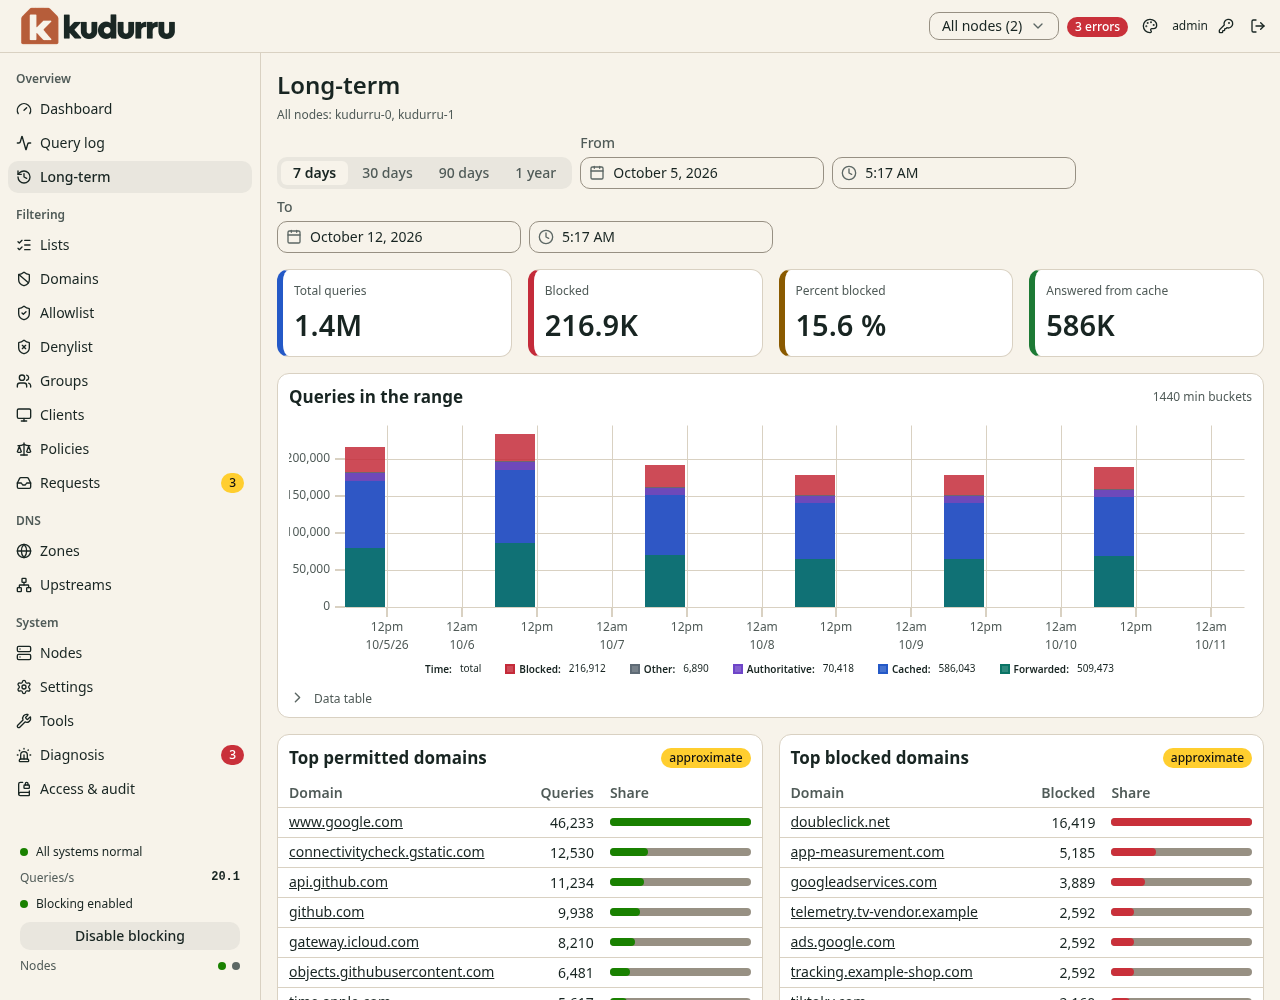
Figure 8. The long-term statistics.
- Select 7 days, 30 days, 90 days or 1 year. You can also set From and To.
- Read the tiles and the chart. The chart has one bar for each time bucket. The text at the top right of the chart gives the size of a bucket.
The tables of the top domains have the label approximate. The numbers in these tables are estimates.
Set the privacy of the query log
The query log can hide the address of a client or the name of a domain. The
setting is querylog.privacy. Use the Settings page or the file
kudurru.yaml. Chapter 8 explains the settings.
NOTE: A privacy mode that hides the client or the name also limits the reason that the block page can show. It also limits the information on the Requests page.