
8. System pages
This chapter explains the pages of the section System: Nodes, Settings, Tools and Diagnosis. Chapter 9 explains Access & audit.
Before you start: You have the role Admin for most functions on these pages. The role Operator can use some tools.
Nodes
Open System > Nodes. Only the role Admin can read this page. Figure 1 shows it.
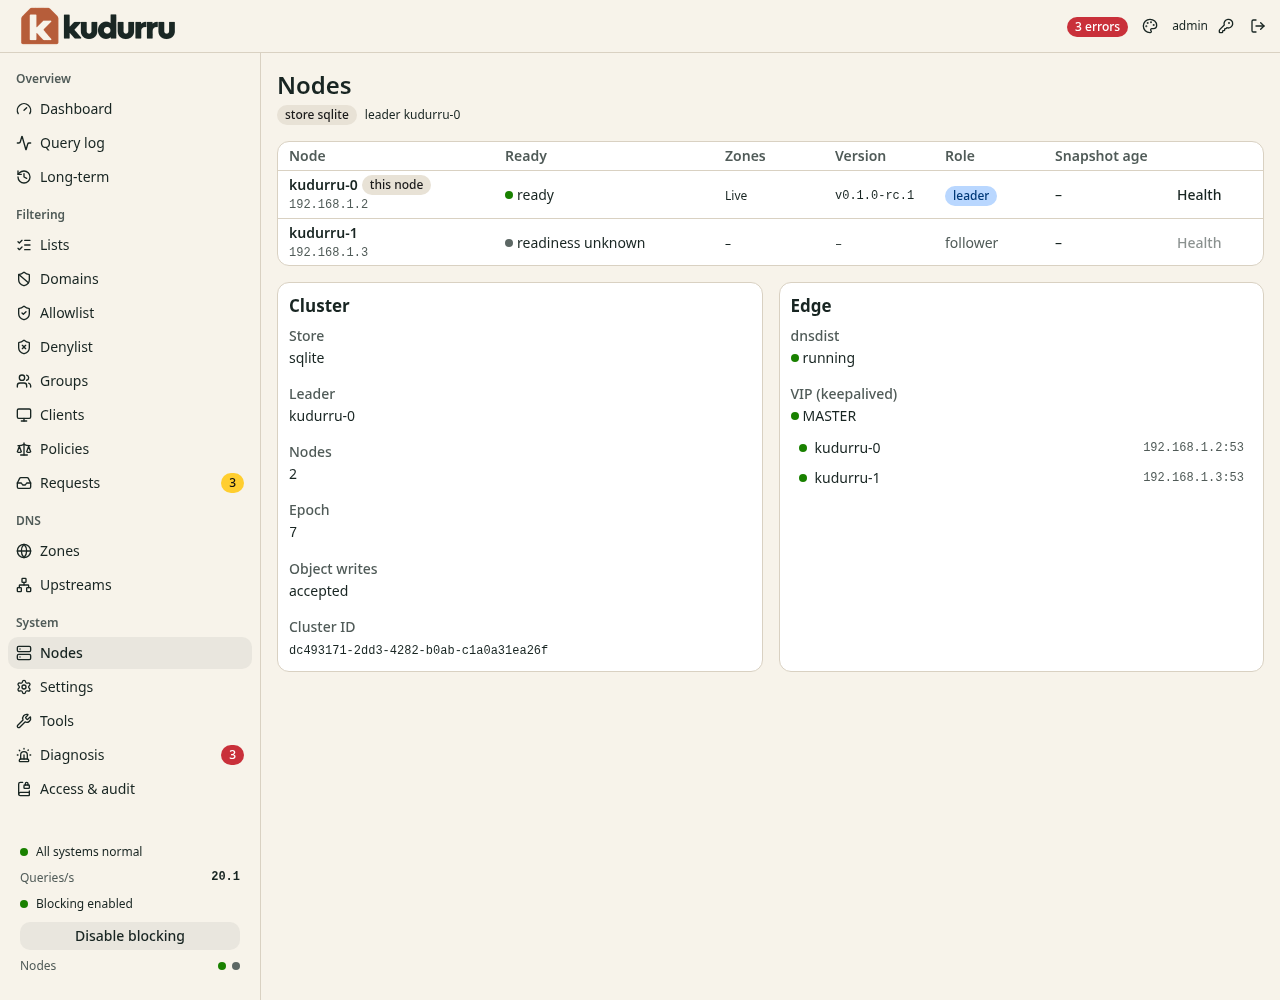
Figure 1. The page Nodes.
The table has one row for each node.
| Column | Meaning |
|---|---|
| Node | The name and the address of the node. The label this node marks the node that serves your page. |
| Ready | If the node is ready to answer queries |
| Zones | The state of the zones on the node |
| Version | The version of kudurru on the node |
| Role | leader or follower |
| Snapshot age | The age of the stored copy of the objects on the node |
One node is the leader. Only the leader does the jobs that must run once, for example the fetch of block lists. If the leader stops, another node takes the role.
Click Health in a row to see the checks of the node.
The card Cluster shows the store (sqlite or kube), the leader, the
number of nodes, the epoch, and if the cluster accepts Object writes. The card
Edge shows the state of dnsdist and of the virtual IP address
(keepalived), if you use them. It also lists the backends.
Settings
A setting is a key and a value. Open System > Settings. Figure 2 shows the page.
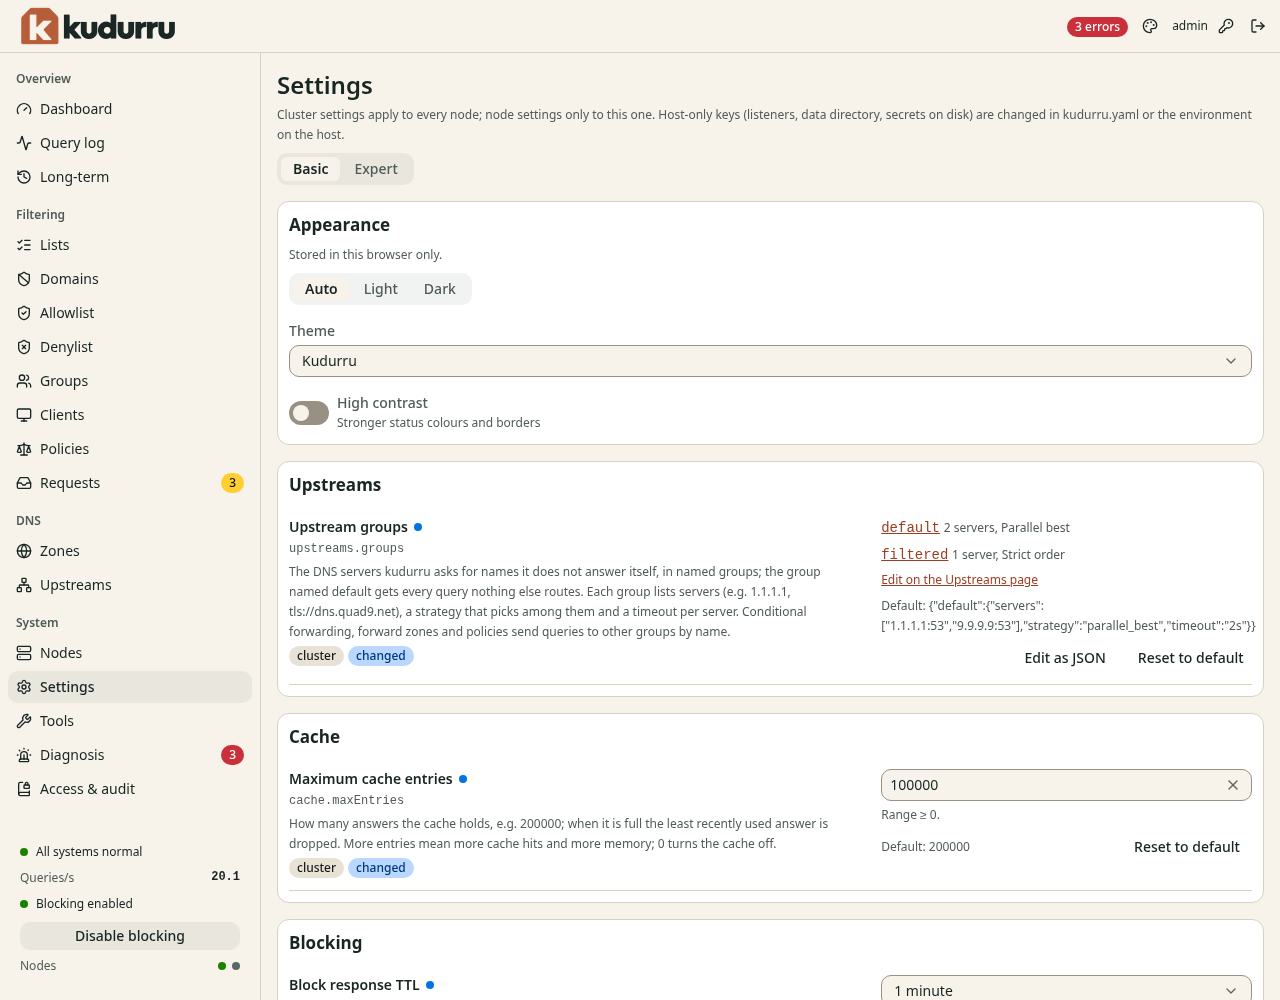
Figure 2. The page Settings.
The page has two views. Click Basic or Expert at the top.
| View | Content |
|---|---|
| Basic | The settings that most administrators need, in sections |
| Expert | All settings, with a search field |
Figure 3 shows the view Expert.
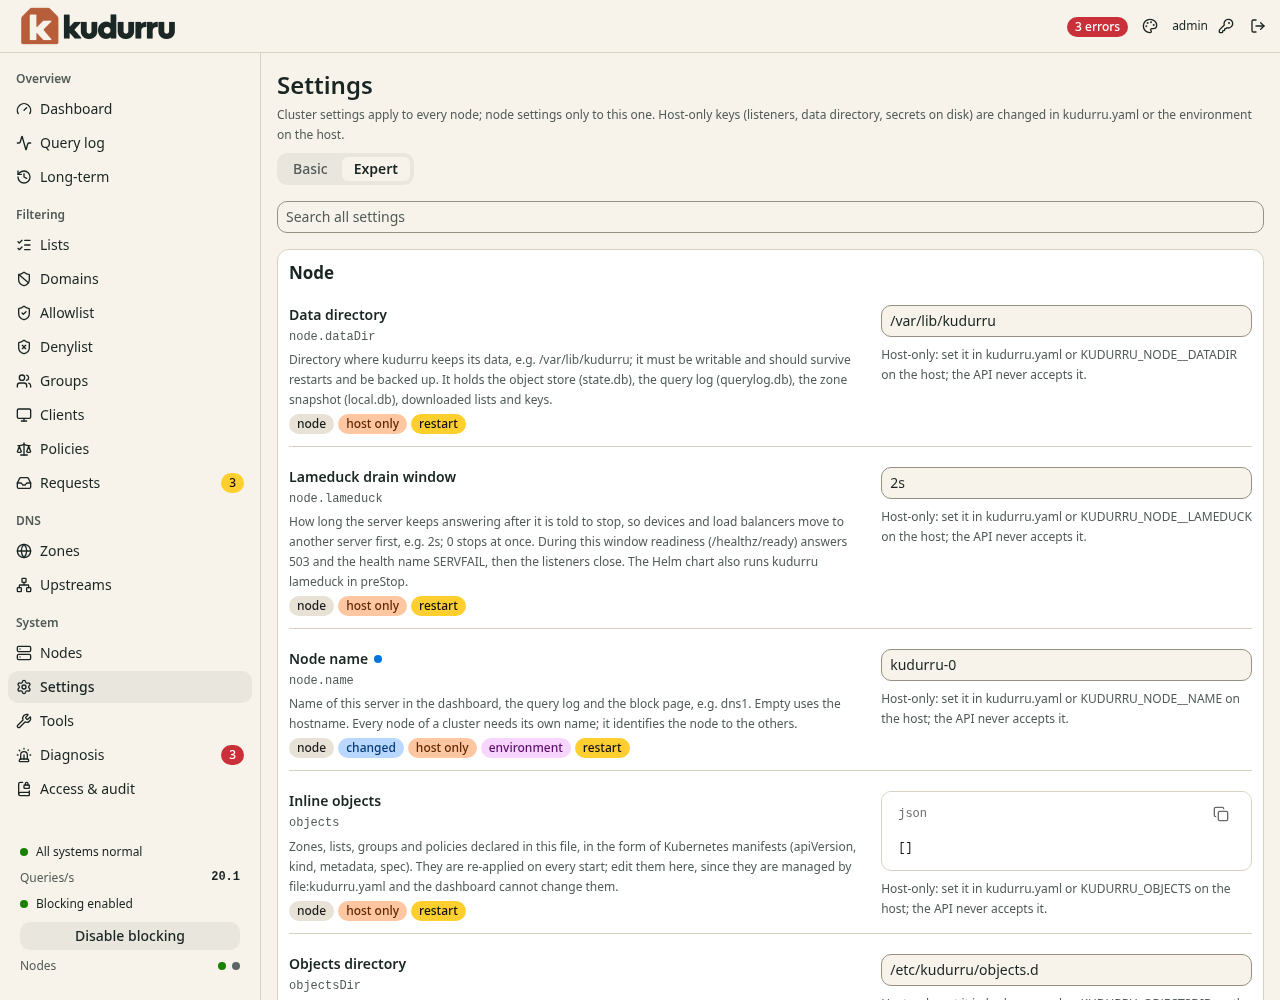
Figure 3. The view Expert.
Each setting has a label for each property.
| Label | Meaning |
|---|---|
cluster | The setting applies to all nodes. |
node | The setting applies to this node only. |
changed | You changed the value from the default. |
host only | You cannot change it in the dashboard. Change it in kudurru.yaml or with an environment variable on the host. |
environment | An environment variable sets the value. You cannot change it here. |
restart | A change takes effect after a restart of the node. |
Change a setting
- Open System > Settings.
- Find the setting. In the view Expert, enter a part of the name in Search all settings.
- Change the value.
- Click Save.
To use a different input form, click Edit as JSON. To go back to the default value, click Reset to default.
CAUTION: A banner Kept in memory only means that the node has no
settings file. The change is lost at the next restart. Set
KUDURRU_SETTINGS_FILE to keep changes.
If a setting needs a restart, the page shows the banner Restart
required. Restart the node. For example, run docker restart kudurru.
The appearance
The section Appearance is for your browser only. It has the choices Auto, Light and Dark, a Theme, and the switch High contrast. You can also click the palette icon in the top bar. Figure 4 shows the dialog.
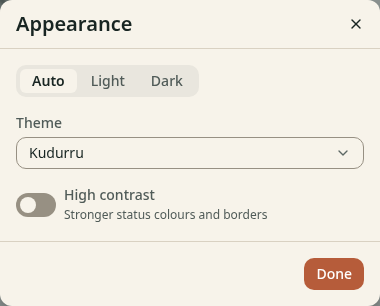
Figure 4. The dialog Appearance.
The block page
The page Settings shows a preview of the block page with your settings. Chapter 6 explains the block page.
All settings
The settings reference lists each setting with its type, its default value and its limits. On the host you can print the list:
kudurru config schema
Tools
Open System > Tools. The page has several tools. Figure 5 shows the tool Query (dig).
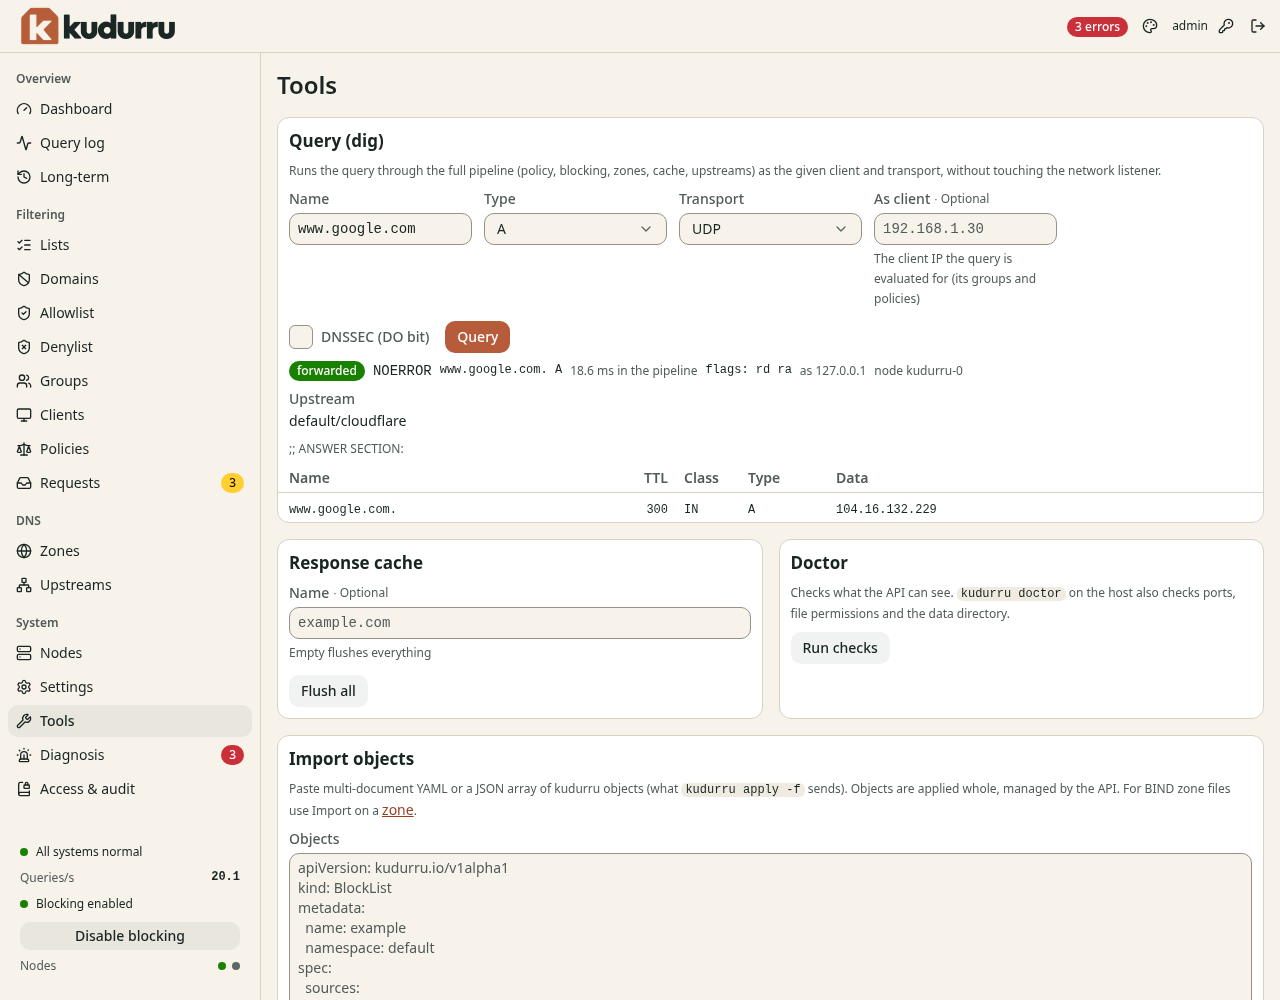
Figure 5. The page Tools.
Query (dig)
Use this tool to see what kudurru does with a name. The query goes through the same steps as a real query. It does not use the network port.
- Enter a name in Name.
- Select the Type, for example
A. - Select the Transport: UDP, TCP, DoT, DoH, DoQ or DoH3.
- To test the rules of a client, enter its address in As client.
- To ask for DNSSEC data, select DNSSEC (DO bit).
- Click Query.
The result shows the status, for example forwarded or blocked list, the
status code, the time, the node and the upstream. Below it are the sections
of the answer.
Use As client to find out why a device gets a different answer. kudurru uses the group and the policies of that address.
Response cache
kudurru keeps answers in a cache. To remove them:
- Enter a name in Name to remove one name. Leave the field empty to remove everything.
- Click Flush all. If you gave a name, the button is Flush name.
The role Operator or Admin is necessary.
Doctor
- Click Run checks in the section Doctor.
- Read the list of checks. A line has the result
ok,warnorFAIL.
The message All checks passed or Some checks failed shows at the
top of the list (Figure 6). The checks on this page are the checks that the
API can make. The command kudurru doctor on the host also checks the
ports, the file permissions and the data directory.
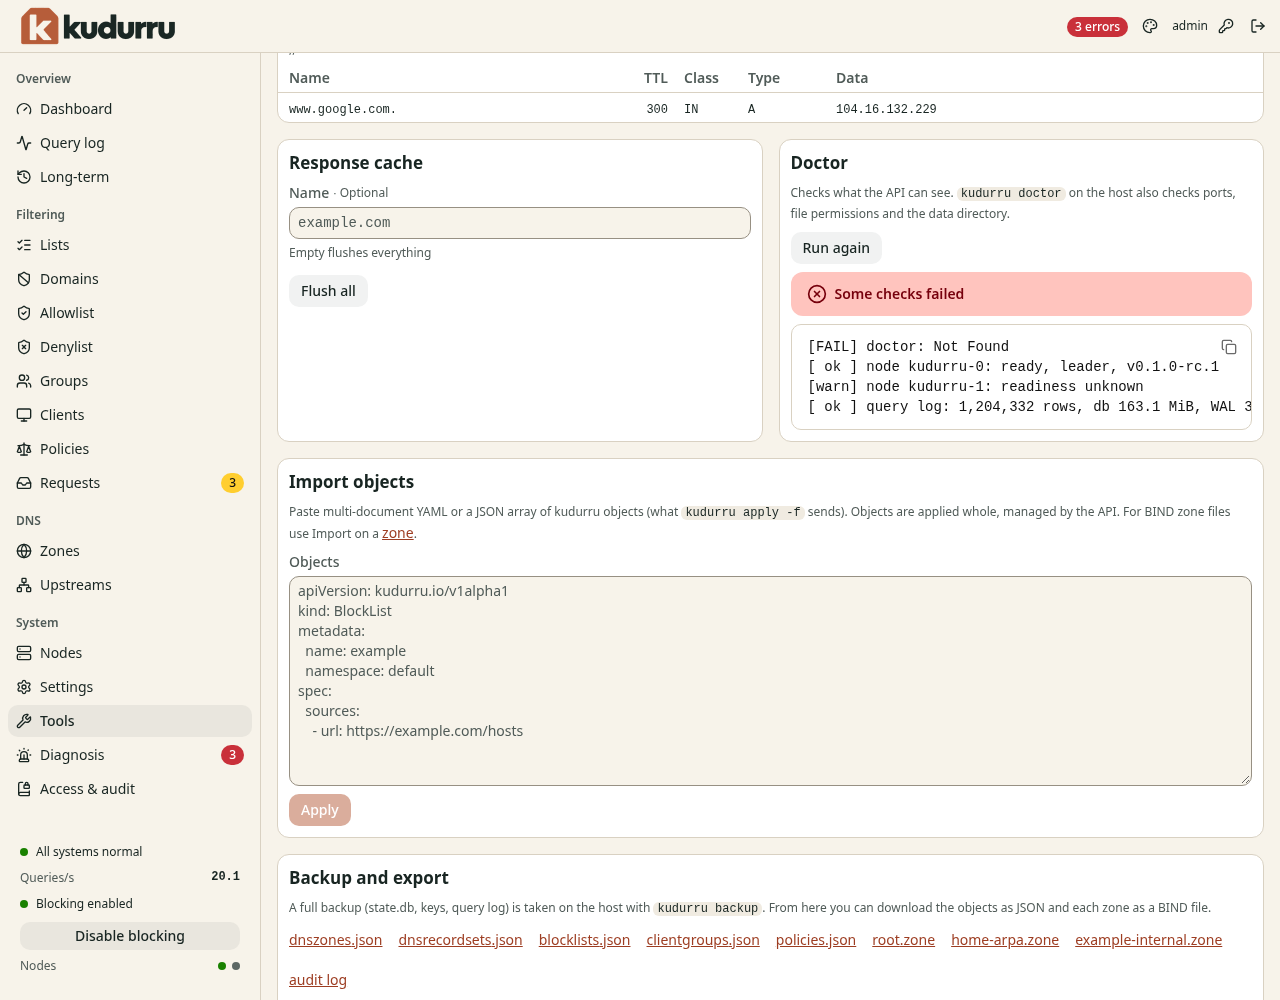
Figure 6. The tools Doctor and Import objects.
Import objects
Use this tool to load objects from YAML or JSON. It does the same as
kudurru apply -f.
- Paste one or more objects into Objects.
- Click Apply.
The page shows the result for each object. kudurru applies each object as a whole. The owner of the objects is API. kudurru refuses an object that a file or Kubernetes owns.
Backup and export
The section Backup and export has links to download the objects as JSON files and each zone as a BIND file. It also has a link to the audit log. These files are not a full backup. Chapter 11 explains how to back up kudurru.
Diagnosis
kudurru checks its own setup all the time. It writes a message for each problem that it finds. Open System > Diagnosis, or click the message badge in the top bar. Figure 7 shows the page.
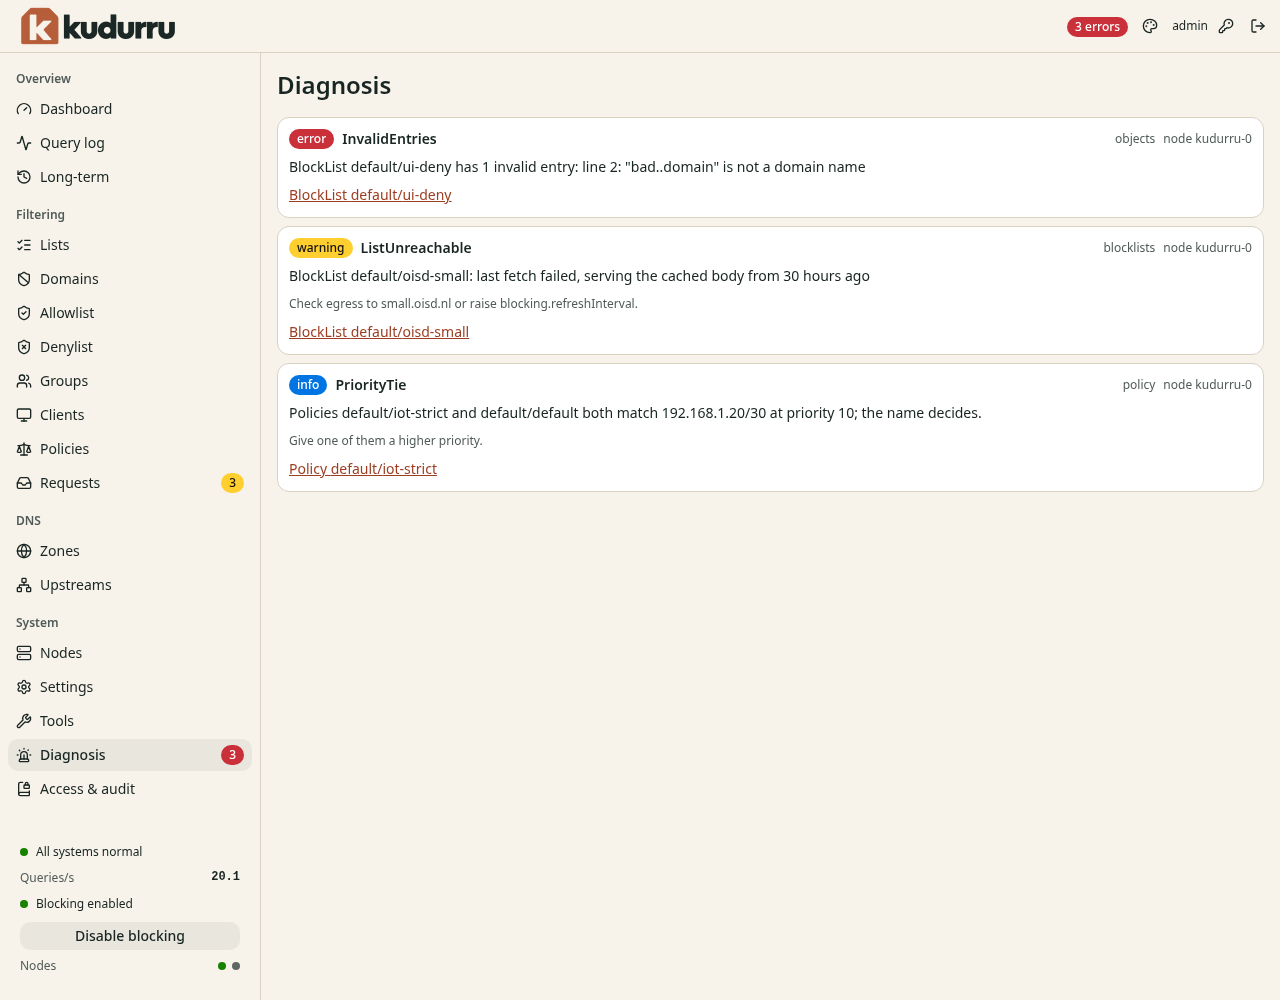
Figure 7. The page Diagnosis.
Each message has a level.
| Level | Meaning |
|---|---|
| error | Something does not work. Do the action soon. |
| warning | Something works, but not as you want. |
| info | A notice. Read it. |
A message has a code, for example ListUnreachable, and a text that tells
you what is wrong. Often it also has a hint that tells you what to do. The
link at the bottom opens the object.
| Code in the example | Cause | Action |
|---|---|---|
InvalidEntries | A list has an entry that is not a domain name | Open the list and correct the entry |
ListUnreachable | The last fetch of a list failed. kudurru uses the copy that it fetched before. | Check that the node can reach the URL. Or make the refresh interval longer. |
PriorityTie | Two policies match the same clients with the same priority | Give one policy a higher priority |
The messages go away when the cause goes away.