
Read dashboard activity
Before you start
- You need the
viewerrole or a higher role. - Connect a test client to kudurru DNS.
Find what changed
- Open Overview > Dashboard.
- Select All nodes or one node in Node scope.
- Read Total queries (24h), Queries blocked, Percent blocked and Domains on lists.
- Click a bar in Queries over the last 24 hours to inspect that time.
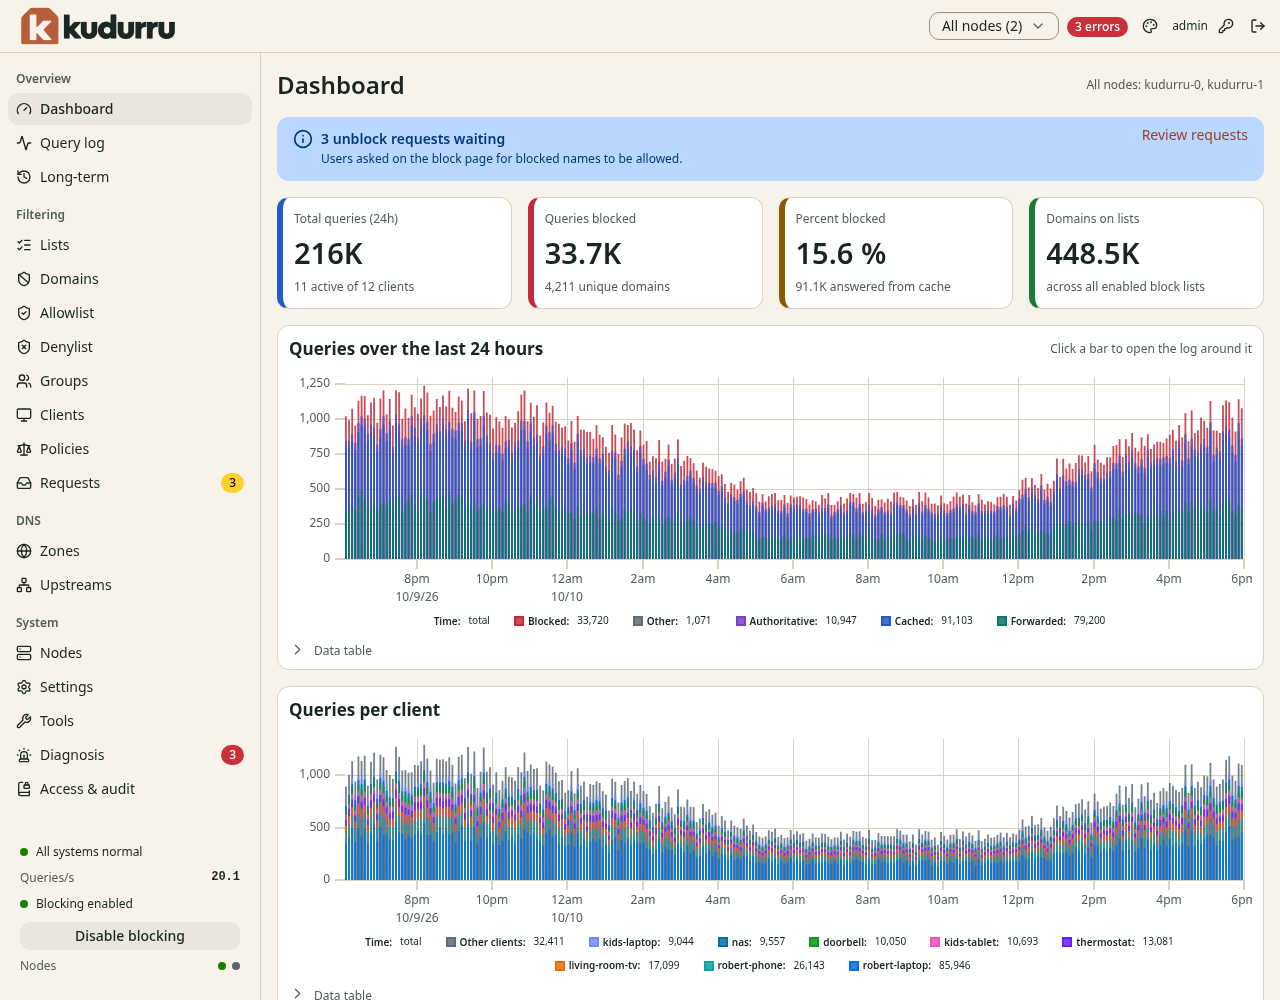
Figure 1. The selected nodes determine the activity shown.
Data table shows chart values as text. Scroll down for query types,
upstreams, top domains and clients. Click a name to open its query log.
Query details need the auditor, operator or admin role.
If a node does not respond, the page reports partial results. Check Nodes before you treat a lower count as lower traffic.
Pause blocking for a test
You need the operator or admin role for this task.
- Click Disable blocking at the bottom of the navigation.
- Select 30 seconds.
- Click Disable.
- Retry the blocked site on one client.
- Click Enable blocking to end the test early.
This pauses block lists. Zones, allow lists and policies remain active. Use Allow a blocked site to make a focused exception.
Check the result
Generate a DNS query from the test client. Open Query log and find the query for its address. Confirm that blocking is enabled after the test.