
Compare DNS activity over time
Before you start
- You need the
viewerrole or a higher role. - You need a license key for statistics older than 24 hours.
- The nodes need collected statistics for the period you select.
Choose a period
- Open Overview > Long-term.
- Select the node scope.
- Select 7 days, 30 days, 90 days or 1 year.
- Read the query count, blocked count, blocked share and cache count.
- Read the time chart for peaks or gaps.
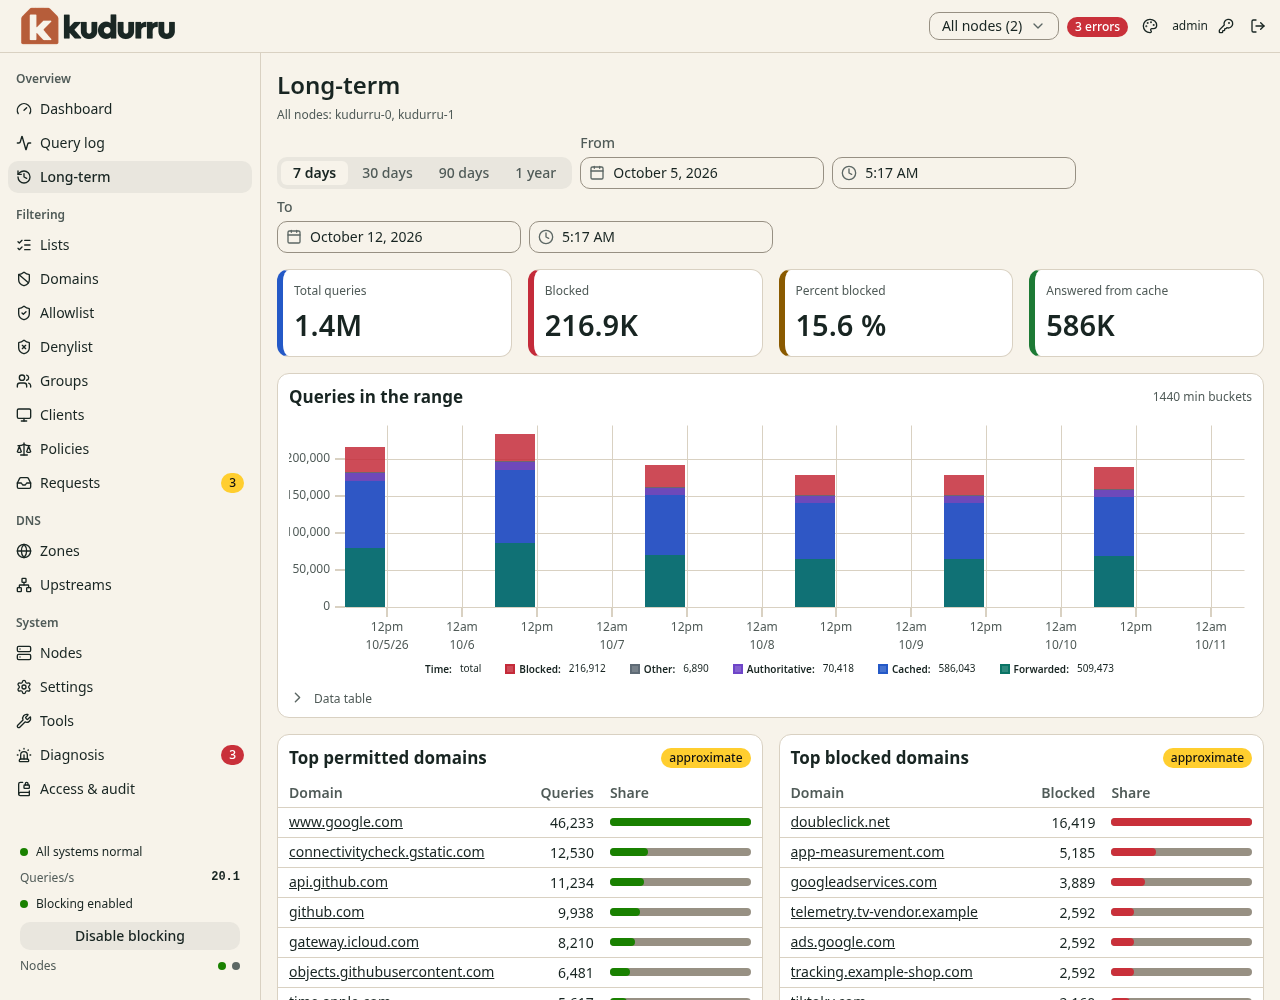
Figure 1. The chart groups queries into time buckets.
Use From and To for a custom period. Data table shows the chart values as text. The top domain and client tables show approximate counts. Use Query log when you need individual retained queries.
Check the result
Switch to another period and confirm that the range and totals update. If the page asks for a key, check License. An empty range can mean the nodes have no statistics for that period.